I’m a Digital Systems Engineer at GE Aerospace building production-grade infrastructure at home — 6-node Proxmox cluster, 12-node K3s Raspberry Pi cluster, full observability stack, and a live NOC dashboard. This blog is where I document the builds, the breaks, and everything in between.
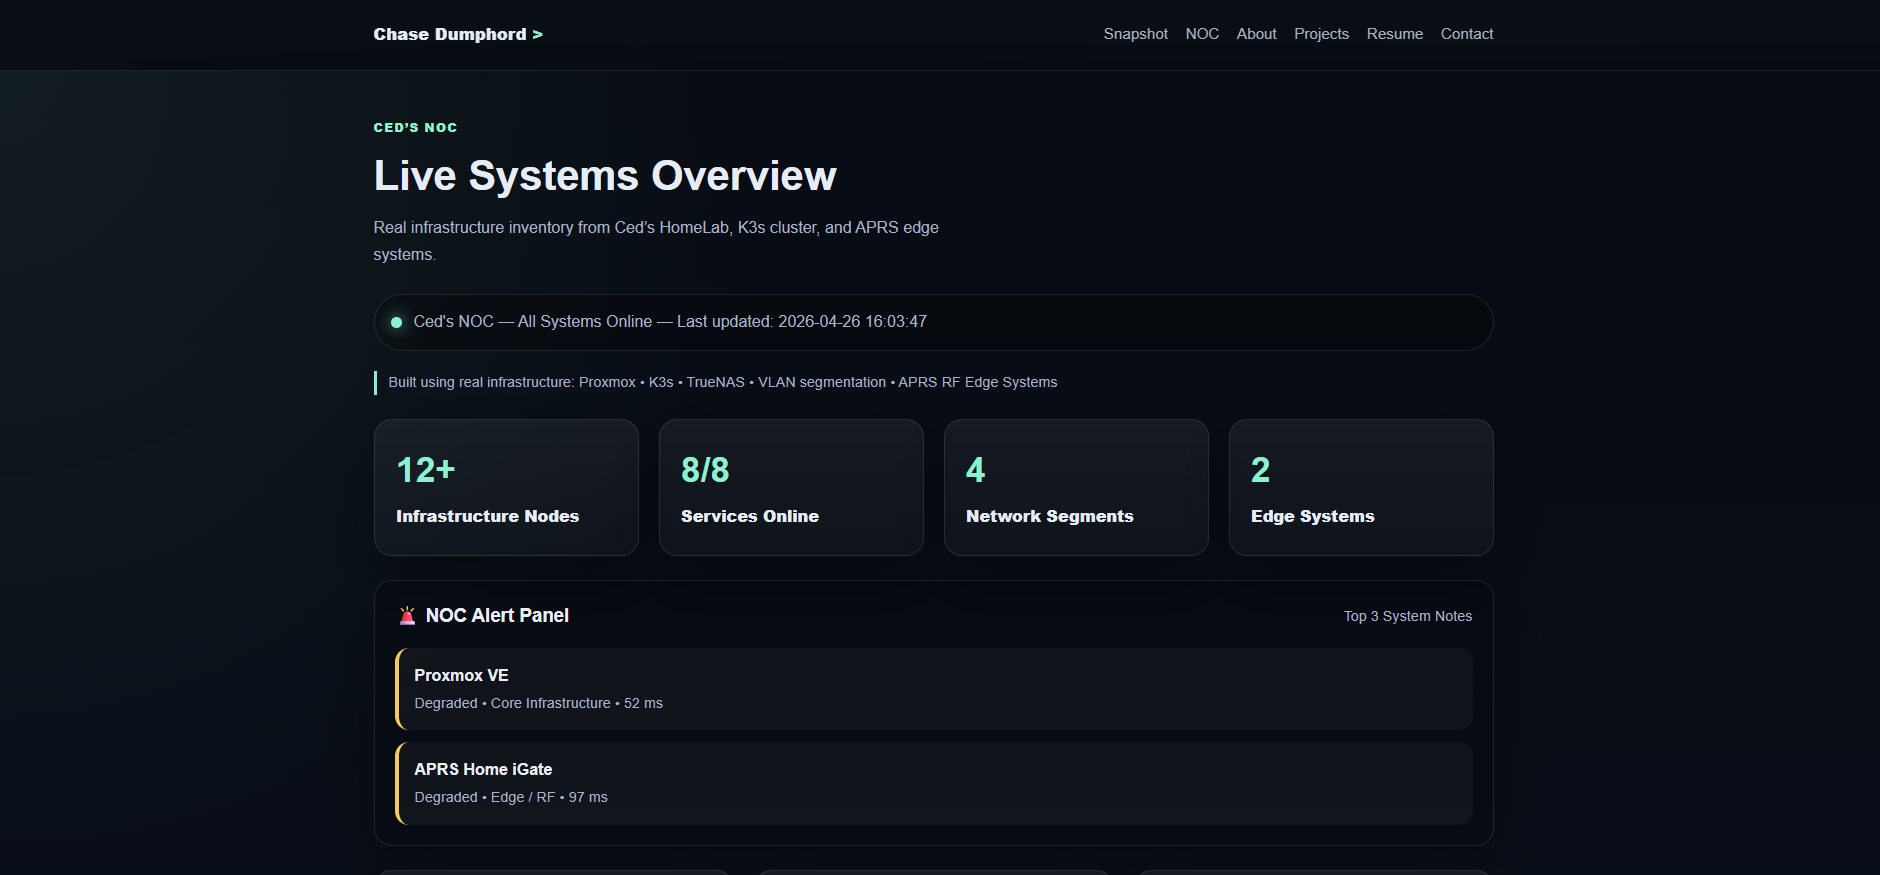
How I Built a Live NOC Dashboard for My Homelab Using Grafana + Prometheus
At some point in every homelab journey, you stop asking: “Can I host this?” And start asking: “How do I know when this thing breaks?” That question sent me down the rabbit hole of observability, monitoring, and infrastructure dashboards. Which eventually turned into something I probably took way too far — a full-blown Network Operations Center (NOC) dashboard for my homelab. And honestly? I regret absolutely nothing. Why I Built a NOC Dashboard When you’re running a 6-node Proxmox cluster, a 12-node Kubernetes cluster, TrueNAS storage, and a dozen self-hosted services — things break. Containers fail. Storage fills up. Services go offline. Networks get weird. ...
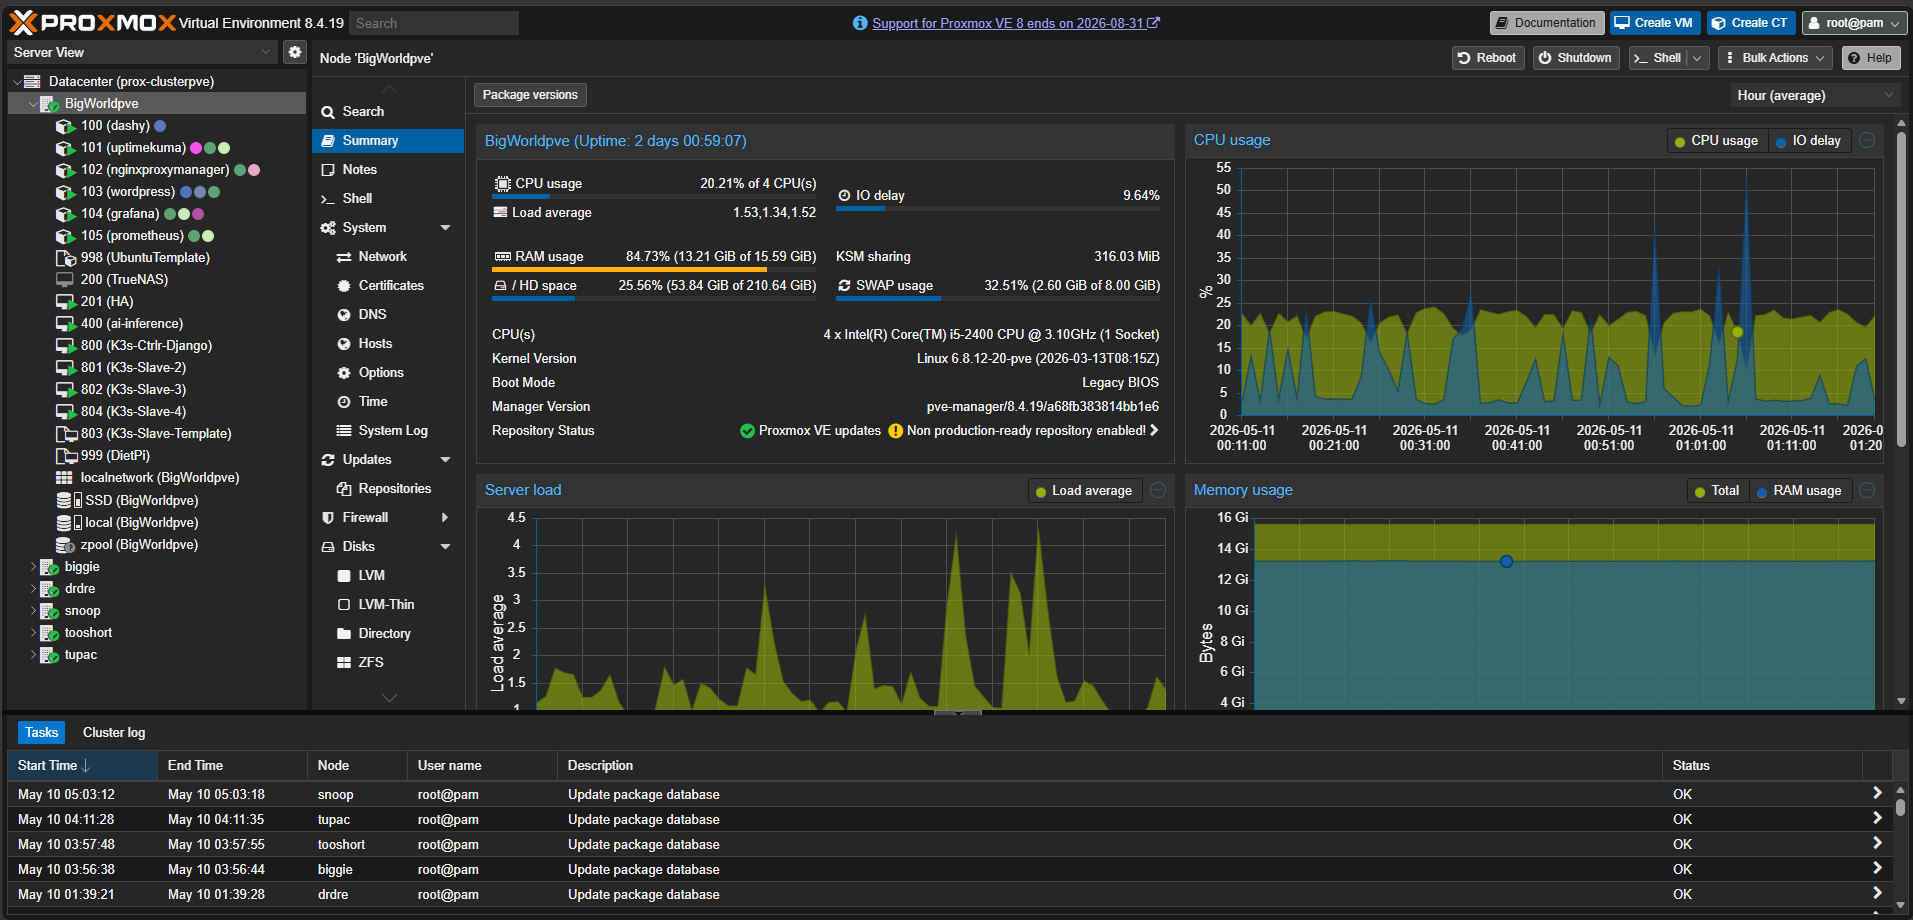
I Found a Dell Tower in the Trash. Five Years Later It's a 6-Node Proxmox HA Cluster.
Most people see an old computer sitting beside a dumpster and think: “Yeah… somebody finally got rid of that thing.” Me? I saw potential. Now before anybody starts judging me — yes, I know how this sounds. But if you’re in the homelab world, into computers, electronics, or just like tinkering with tech, then you already know the truth: Old hardware isn’t dead hardware. It’s just waiting for somebody nerdy enough to resurrect it. ...